The X Ray of Time and Capillaries of Process
Waste loves to hide in the dark; the moment you draw a process on paper, you destroy all the hiding places of invisible losses.
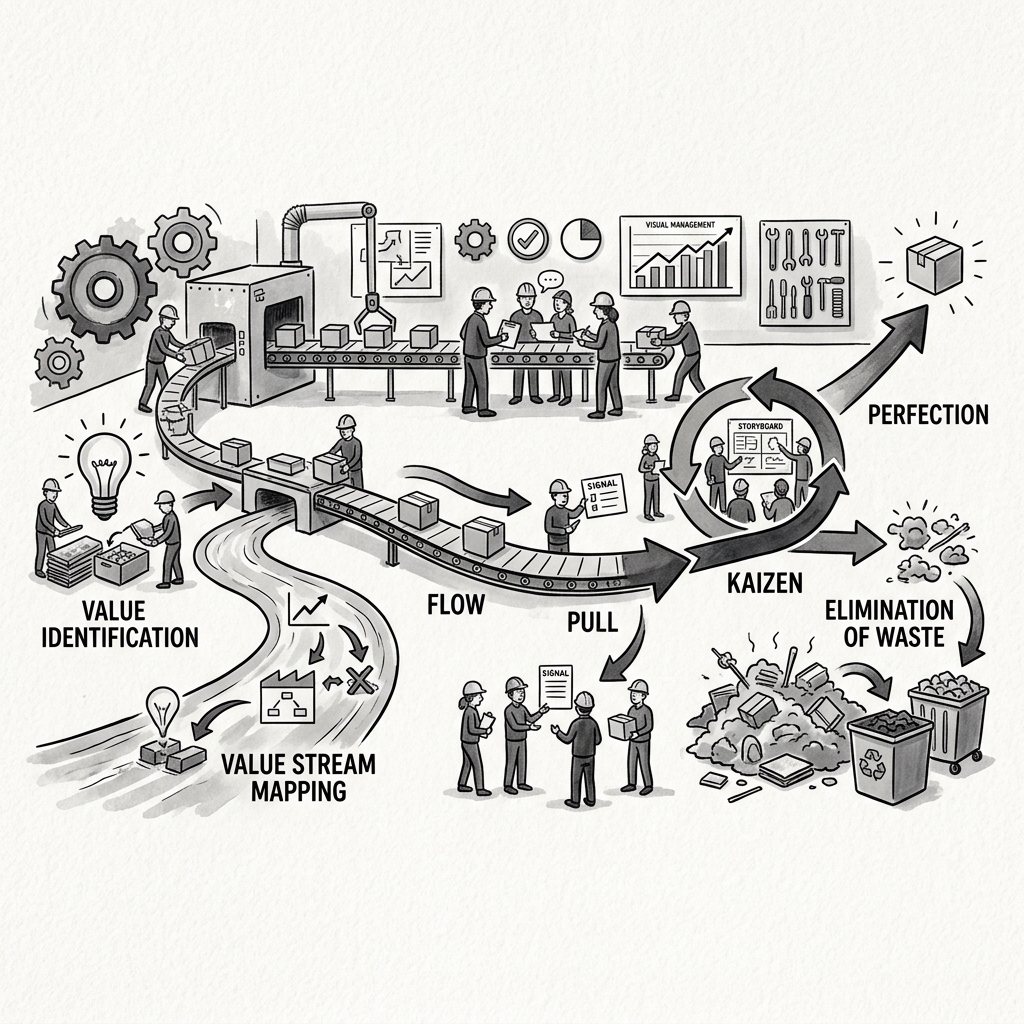
Value Stream Mapping (VSM) is a strategic analysis system that acts as an X-ray for complex business processes. It visualizes the entire flow of materials and information on a single piece of paper, from the first second raw materials enter a factory door to the final moment the finished product reaches the customer's hands. Its sole purpose is to ruthlessly expose exactly where "value" is genuinely created and where "time" is merely lost (waste) within the process.
Think of this mapping technique as a smart drone hovering in the sky, tracking a delivery driver's route. The drone does not care how fast the driver walks with the package. The drone's true focus is on calculating the total time the driver loses at red lights, wrong addresses, and traffic jams (non-value add waiting times). Walking faster (local optimization) does not solve the problem; the real engineering challenge is eliminating the traffic and red lights (bottlenecks) to draw a new, smooth, and frictionless shortcut.
The Core Dynamics of the Map
Value Stream Mapping is built upon critical building blocks that constantly interact with one another. It is impossible to manage the whole without understanding these foundational elements.
Value-Add Time
Value-add time is the duration spent on actions for which the customer is actually willing to pay.
- Cutting, bending, and shaping a piece of metal is value-add.
- Writing the actual code for software is value-add.
- These durations typically make up a very small fraction (e.g., only 5%) of the entire production cycle. It is the only moment real work is being accomplished.
Non-Value Add Time
These are the waiting and transportation times that add zero value to the product, and for which the customer would never want to pay.
- Cut metal sitting in a warehouse for 3 days waiting to go to the next machine is non-value add (Waste).
- A document sitting on a manager's desk for 48 hours waiting for approval is a complete loss.
- Value Stream Mapping is specifically designed to hunt down and eliminate these waiting periods.
Material and Information Flow
In a system, not only do materials move, but information moves as well.
- Material Flow: The physical journey of the product between machines and warehouses.
- Information Flow: The electronic journey of production orders, customer requests, or approval mechanisms across departments.
- A blockage in the material flow is very often caused by a disconnection or lag in the information flow.
Cycle Time vs. Lead Time
These two metrics are the most fundamental speed indicators measuring how time is spent.
- Cycle Time: The active time an operator or machine spends processing a single unit of product (e.g., 2 minutes).
- Lead Time: The total time elapsed from the moment an order enters the factory until the product is delivered to the customer (e.g., 14 days).
- The massive gap between these two (waiting 14 days for 2 minutes of actual work) is the definitive mathematical proof of hidden waste and inventory piles within the system.
The Mechanics of Optimization
After drawing the Current State Map, the real engineering work begins. Companies look at this X-ray and design a "Future State Map."
Identifying bottlenecks and removing intermediate inventory is the heart of this work. Piling up unnecessary inventory between every machine is like building dams that collect water; it slows the water down. Instead, the ultimate strategy is to connect the system and create a continuously, smoothly flowing river (continuous flow).