The Anatomy of the Root Cause
Treating superficial symptoms only delays the inevitable; permanent excellence requires a ruthless excavation down to the genetic code of the problem.
In the world of operational excellence, when a quality problem arises, the initial reflex is often to attack the most visible error. However, a visible defect is merely the fever of an underlying illness. The Ishikawa (Fishbone) Diagram is a systematic investigation and analysis framework designed to bypass superficial symptoms and uncover the true Root Cause of quality issues. A slowdown in a production line, a bug in software, or a customer complaint; these are all outcomes. The Ishikawa diagram allows us to dismantle the invisible mechanisms behind these outcomes and analyze them piece by piece.
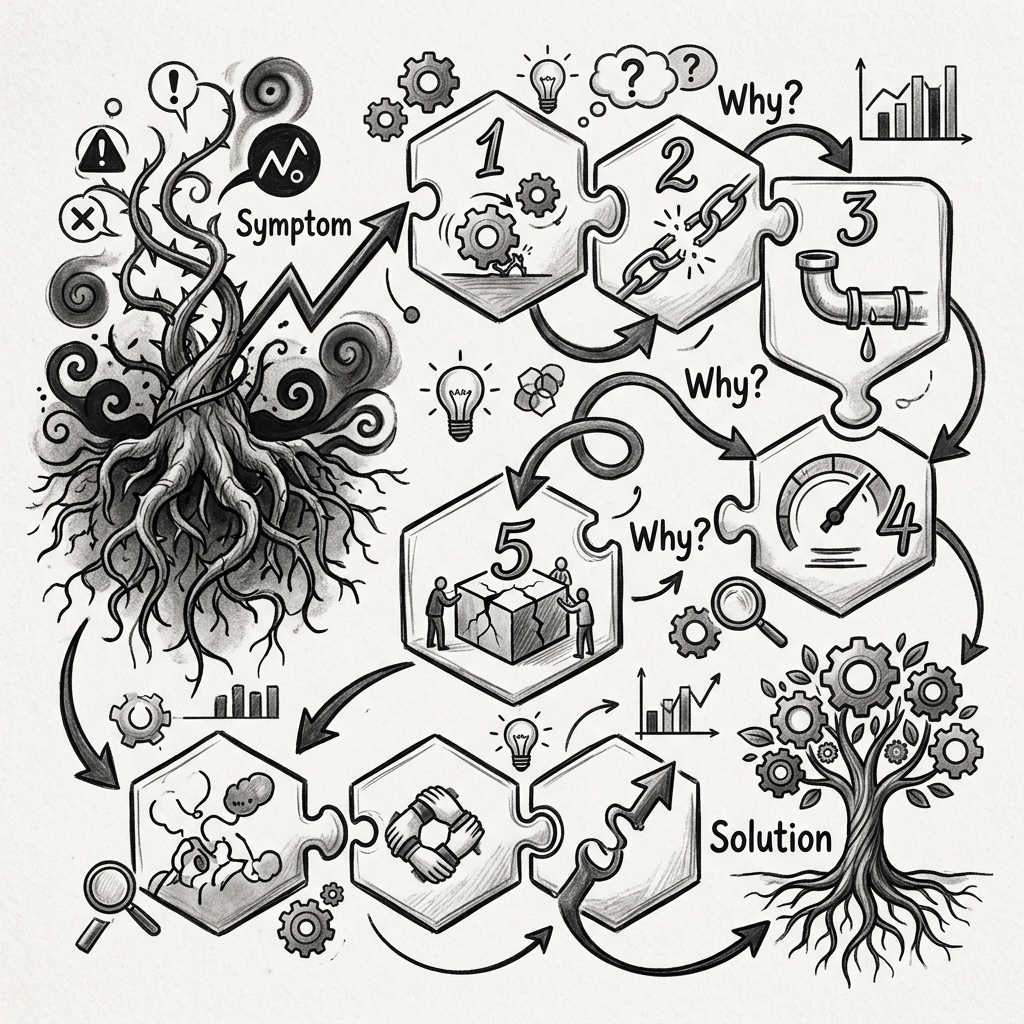
We can think of this tool not as looking at the rotting leaves of a sick tree, but rather as an x-ray machine that maps the massive root system hidden underground. Plucking or painting the drying leaves will not solve the problem; one must find the actual root causing the disease and cut it out. While the spine of the diagram represents the main problem, the branches (bones) extending from the spine indicate the subsystems producing the error. In industrial analysis, this root system is typically scanned across six main categories, known as the 6M framework.
The 6M Framework and Root Cause Analysis
Any process failure is a complex interaction of seemingly independent variables. The Ishikawa diagram classifies these variables not randomly, but within a specific architectural order.
Human Factor (Man / Mindpower)
Humans are at the center of systems. This category examines human-induced variables such as physical fatigue, inadequate training, lack of motivation, or distraction.
- An operator running a machine without adequate training can directly cause a production error.
- This does not just mean "they made a mistake"; by asking "why did they make a mistake?", it reveals root causes like competence gaps or poor shift scheduling.
Machinery and Equipment (Machine)
The physical hardware, software, and tools that execute the production or service are analyzed in this category.
- An unmaintained lathe, a miscalibrated sensor, or a slow server can be the source of the main problem.
- When we dig into the roots of the tree, the problem might not be the machine itself, but the lack of a preventive maintenance (PM) schedule for that machine.
Material Quality (Material)
The compliance of all raw materials, data, information, or consumables entering the process with the required standards is evaluated.
- Micro-cracks inside a steel component or incorrectly entered customer data can snowball into a massive quality problem at the end of the process.
- The root cause of defective material is often the selection of a cheap, low-quality supplier or the inadequacy of the incoming quality control (IQC) process.
Methodology and Processes (Method)
This is the set of procedures, instructions, and rules that define how the work is done.
- If there is no standard operating procedure (SOP) for a task, or if the current method is unnecessarily complex, failure is inevitable.
- Executing a flawed method perfectly will ultimately still result in a defective product.
Measurement and Metrics (Measurement)
This questions the accuracy of the tools and criteria we use to evaluate the problem.
- If the micrometer measuring quality is broken, or software test scenarios are incomplete, we might label a good product as defective, or a defective product as good.
- The root cause is sometimes not in the defect itself, but in the lack of calibration of the system measuring the defect.
Environmental Factors (Mother Nature / Environment)
This covers the effects of the physical or operational environment in which the system operates.
- Factors like temperature, humidity, dust, noise, or lighting directly affect both the material and human performance.
- For example, a sudden increase in humidity in a paint shop can lead to quality issues on the product surface; in this case, the solution is not to change the paint, but to fix the ventilation system.