
The Storm Behind the Calm
The most hazardous moments in the financial markets are those periods of absolute serenity—when charts move in boring horizontal lines and the general crowd slips into complete complacency. Retail amateurs interpret this stagnation as a definitive sign of safety, assuming the asset has finally been tamed. However, deep inside the structural mechanics of price delivery, a brutal statistical law discovered by Benoit Mandelbrot is actively operating: Volatility Clustering. Large changes tend to be followed by large changes, and small changes tend to be followed by small changes.
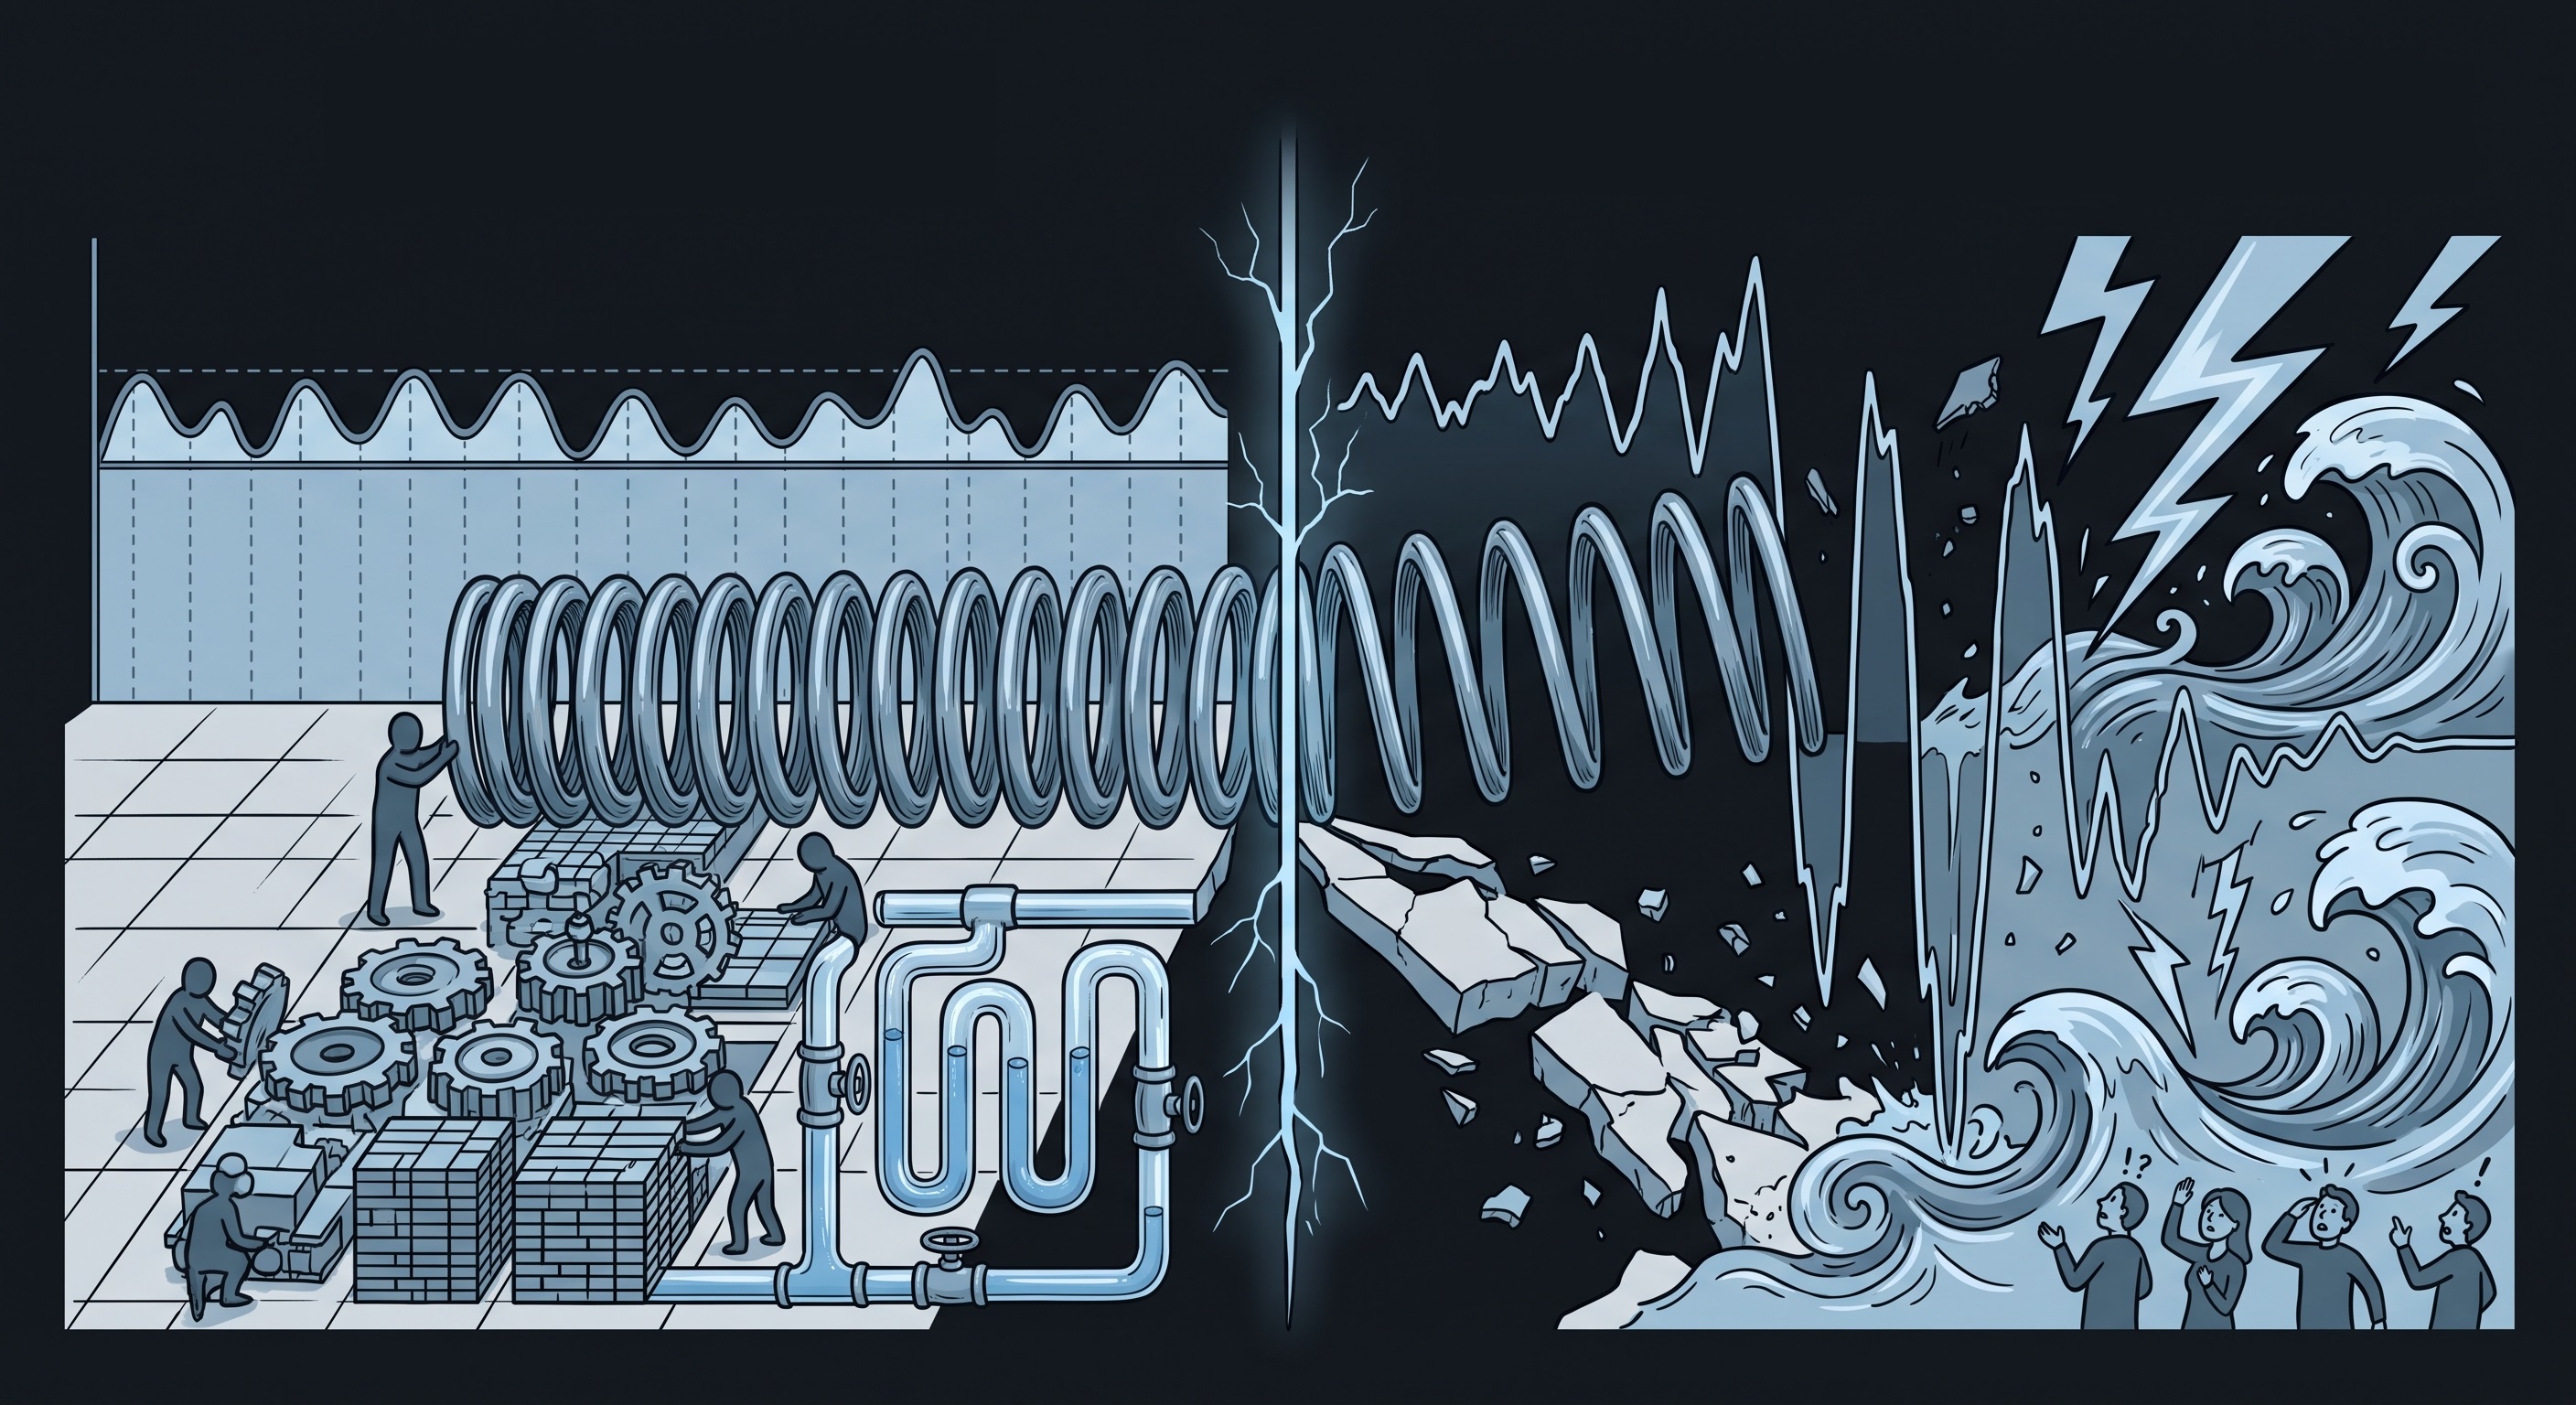
Calm is never a peaceful harbor; it is a corporate spring compressing the raw potential energy of the next financial storm. Defending your financial sovereignty as an investor means abandoning the foolish attempt to guess what the price will be tomorrow. Instead, you must analyze these periods of extreme compression as data-driven indicators that predict explosive price expansions.
The Financial Spring: Why Volatility Clusters
Traditional economic models operate on the flawed assumption that market returns are independent and normally distributed from one day to the next. Physical reality proves exactly the opposite. Financial markets are non-linear, complex adaptive systems. The transmission of capital and information moves in structural waves.
- Calm Breeds Calm (Energy Accumulation): When price compresses inside a tight range, the superficial eye assumes a healthy equilibrium has been established. In reality, during this sequence, smart money is quietly anchoring orders, institutional algorithms are packing order books, and market liquidity is tightening like a vice. The less the price moves, the higher the structural potential energy scales toward its mathematical limit.
- Volatility Triggers Volatility (Kinetic Expansion): When this highly compressed spring is released by a single catalyst or systematic data print, the stored energy transforms instantly into raw kinetic force. The first massive price expansion triggers cascading stop-losses, liquidates over-leveraged accounts, and forces the emotional crowd onto the field. This is why a massive directional move on day one inherently cross-contaminates day two, driving a chain reaction of systemic volatility.
Decoding the Squeeze: The Sovereign Analytical Filter
Market makers rely on the fact that retail amateurs only notice an asset once vertical velocity has already begun. By the time the general public jumps in, risk parameters are entirely compromised and the asset is trading far away from objective value. To protect your capital, apply this strict diagnostic filter:
- Band Compression Metrics: When standard deviation bands or historical volatility metrics compress to their lowest historical percentiles, the system has reached the terminal limit of Mandelbrot's "calm" phase. Attempting to predict the directional breakout at this exact crossroad is a fool's gamble. Do not track direction; calculate the structural magnitude of the impending expansion.
- The Low-Volume Lock: A dramatic drying up of volume during a sideways squeeze does not signal a dead market. It proves that supply and demand have achieved a perfect, temporary lock. The moment this lock fractures, volatility will replicate across the entire chart like a systemic virus.
Focus your analytical lens precisely where the loud market commentary claims "nothing is happening." True wealth is never generated by chasing a storm after it has already made landfall. It is engineered through cold, data-driven execution inside the profound quiet that precedes the blast. The tighter the compression, the more absolute the mathematical expansion.