
The Mathematical Gravity of Price
When market euphoria runs rampant or a wave of panic paints every screen red, most investors fall victim to the illusion that the current trend will persist forever. As prices rocket upward, narratives of permanent expansion are constructed; when they crash, scenarios of complete doom dominate the room. Yet, in the deepest structural layers of the financial markets, a brutal and unavoidable law is constantly operating: Mean Reversion. No matter how far a price runs, it is mathematically destined to pull back to its baseline.
Defending your financial sovereignty as a retail investor requires you to look past emotional swings and decode this statistical gravity. Price is a temporary opinion, but historical baselines represent objective reality.
The Structural Rubber Band: Standard Deviation and Baselines
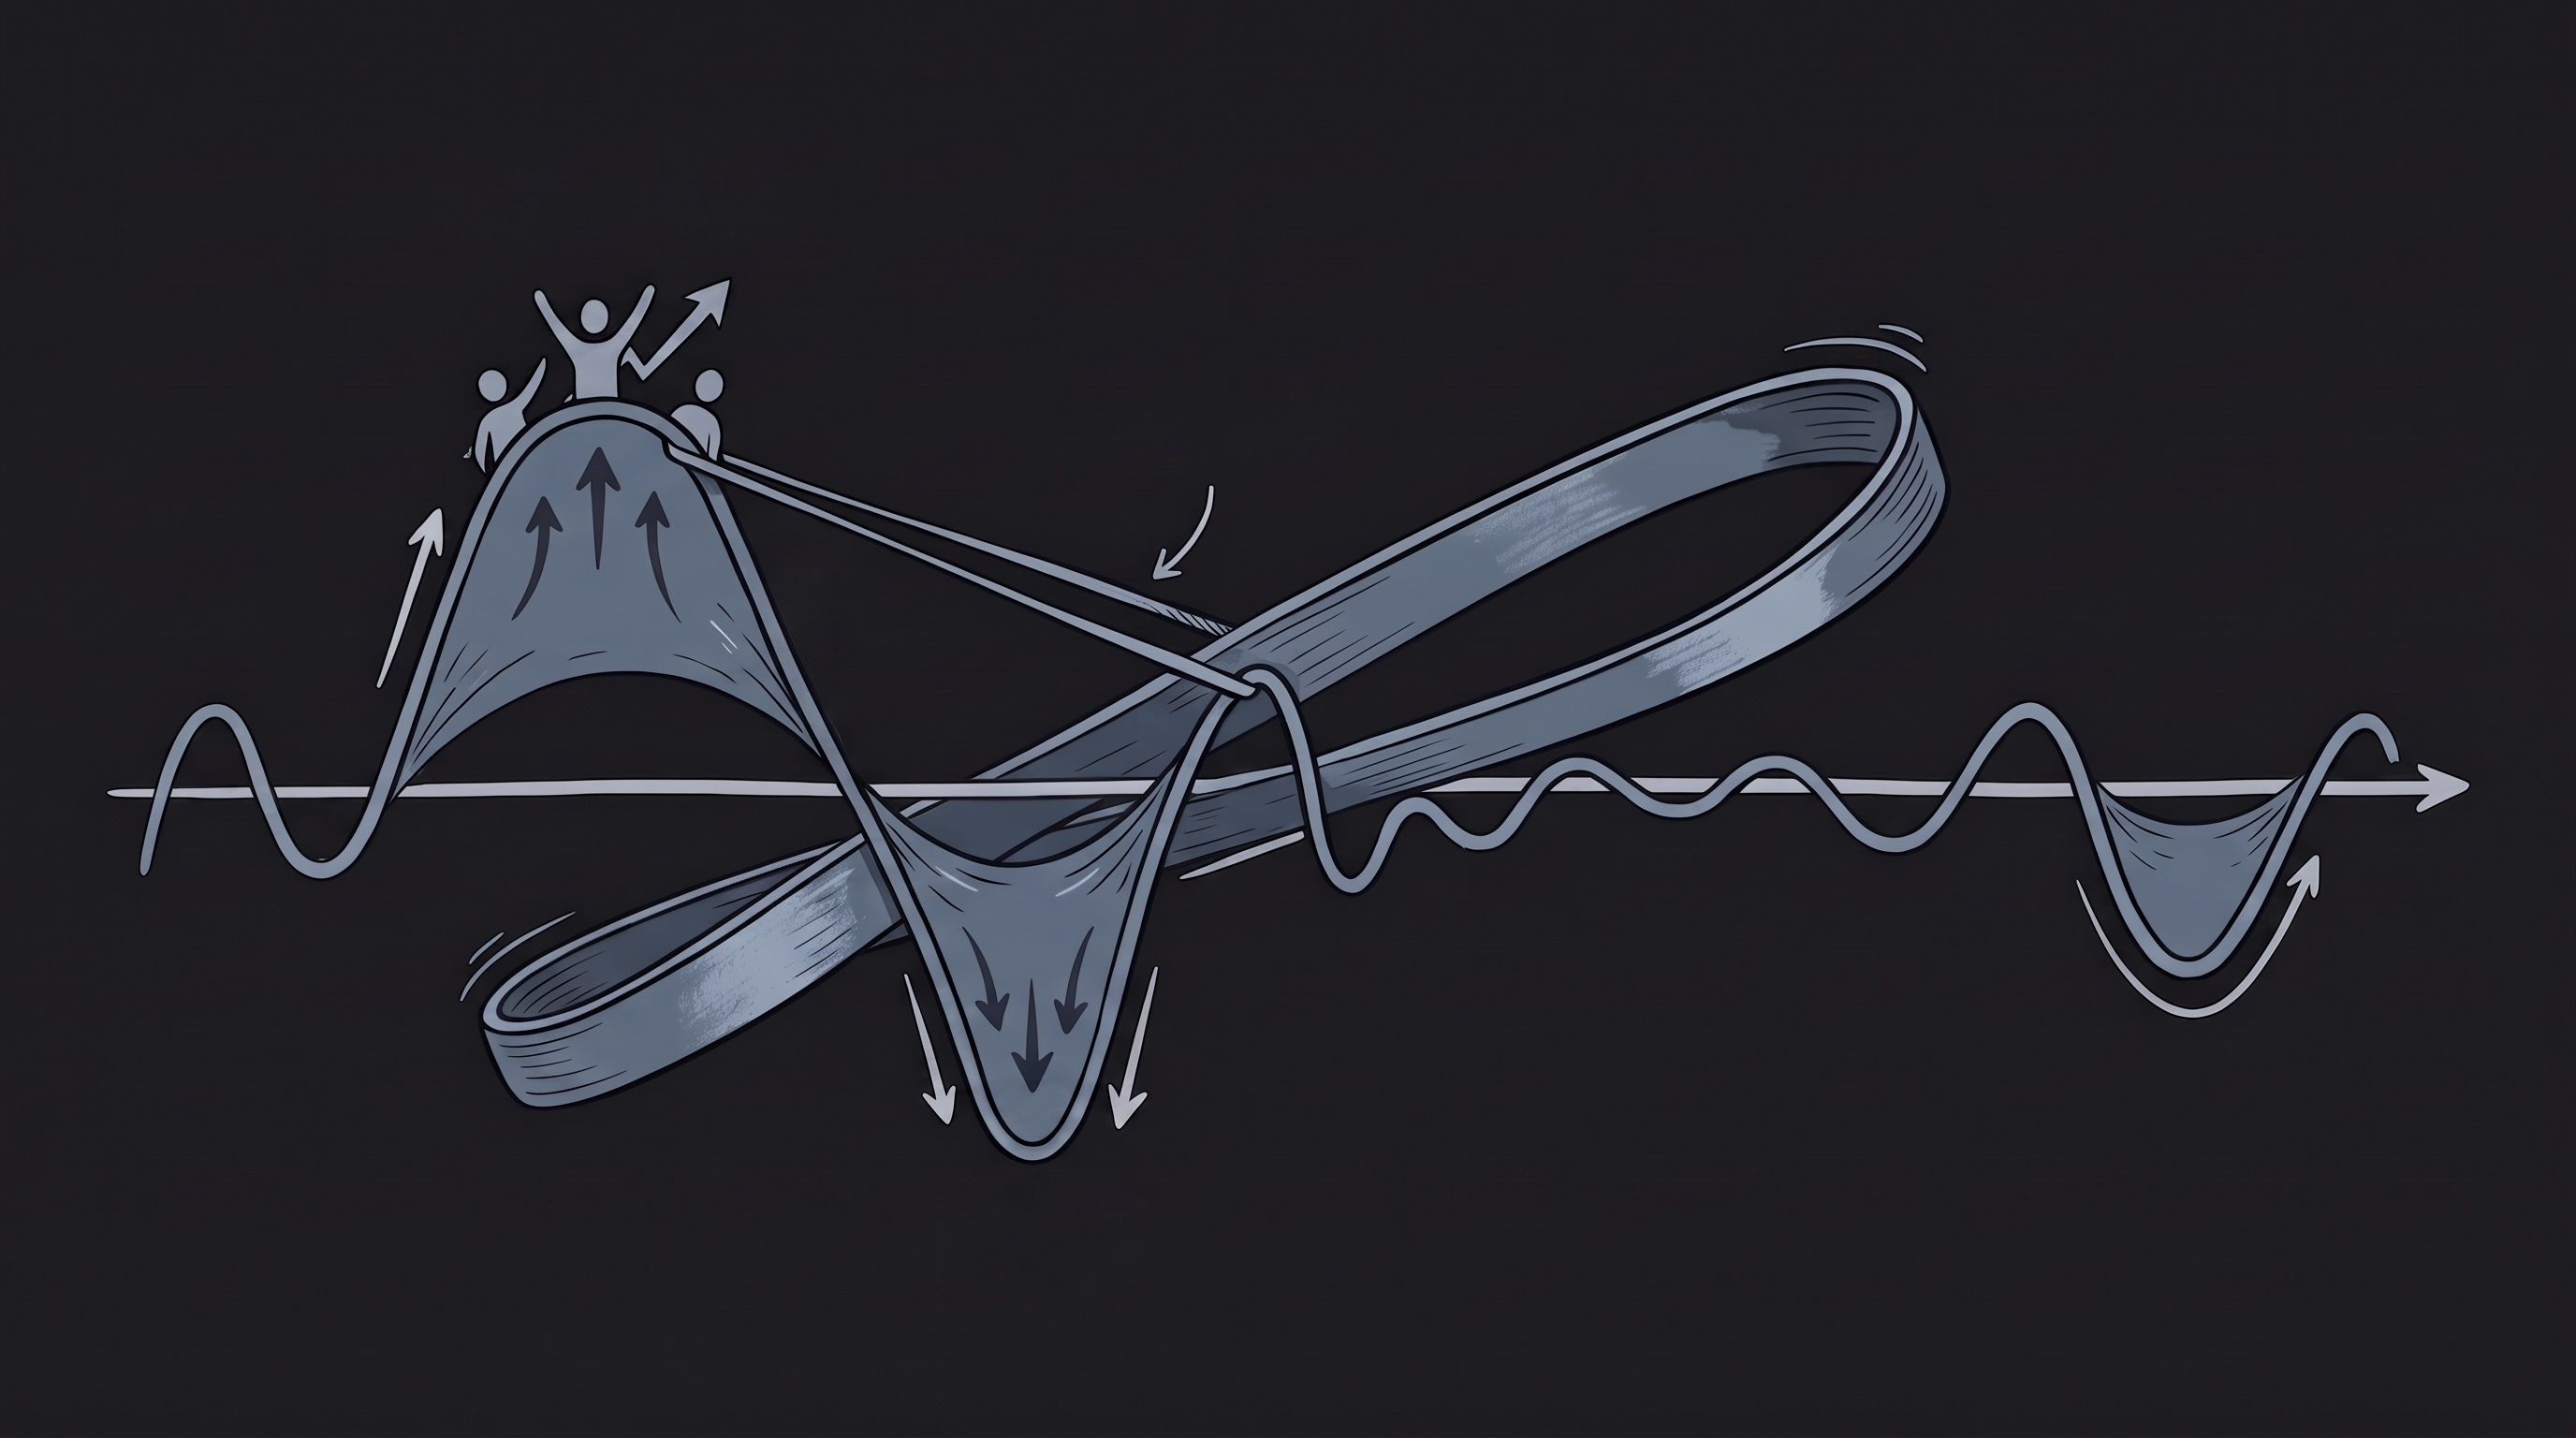
To analyze price trajectory, visualize the asset as connected to its long-term moving average by a heavy rubber band. The further the price accelerates away from its average, the greater the structural tension accumulating within the band.
- The Historical Baseline: Moving averages represent the central baseline of balanced value over time. This path is the mathematical consolidation of the company's real economic efficiency and liquid cash flows.
- Standard Deviation Tension: Standard deviation calculates the exact distance the price travels away from its baseline. When the deviation scales to $2\sigma$ or $3\sigma$ thresholds, the structural rubber band is stretched to its absolute limit. At these extreme boundaries, statistical probabilities dictate that the trend cannot comfortably sustain itself; instead, a high-velocity snapback to the baseline becomes inevitable.
Dissecting the Illusion of Extremes
Market makers and smart money are highly aware that the general crowd operates completely blind to this rubber-band tension. The exact moments when retail investors feel the most confident or terrified are precisely when the elastic structural limit is stretched to its maximum capacity.
- The Euphoric Peak Trap: When the rubber band is stretched to its upper limits, institutional news outlets broadcast flawless growth narratives. Everyone constructs theories on why the asset has escaped physical limits. Yet, the mathematical gravity of price is quietly preparing to engage. Once the standard deviation reaches historical extremes, buyer velocity dries up, and the asset is dragged back toward its moving average.
- The Capitulation Spring: The identical structural tension applies during sharp downward momentum. When price collapses far below the historical baseline, late-stage retail panic assumes the company is heading to zero. However, if the core cash-flow engine remains intact, this extreme negative deviation acts as a compressed spring prepared to launch the asset back to its natural equilibrium.
Ignore the noisy sentiment of the crowd. Focus your lens not on where the price is momentarily trading, but on how far it has expanded away from its historical baseline. Remember, in the laboratory of the financial markets, no speculative momentum is stronger than mathematical gravity.